Author
Steven Bees and Lee Surtees
Partner Agents, Muvin.
Independent estate agents, brokered by eXp.
Independent estate agents, brokered by eXp.
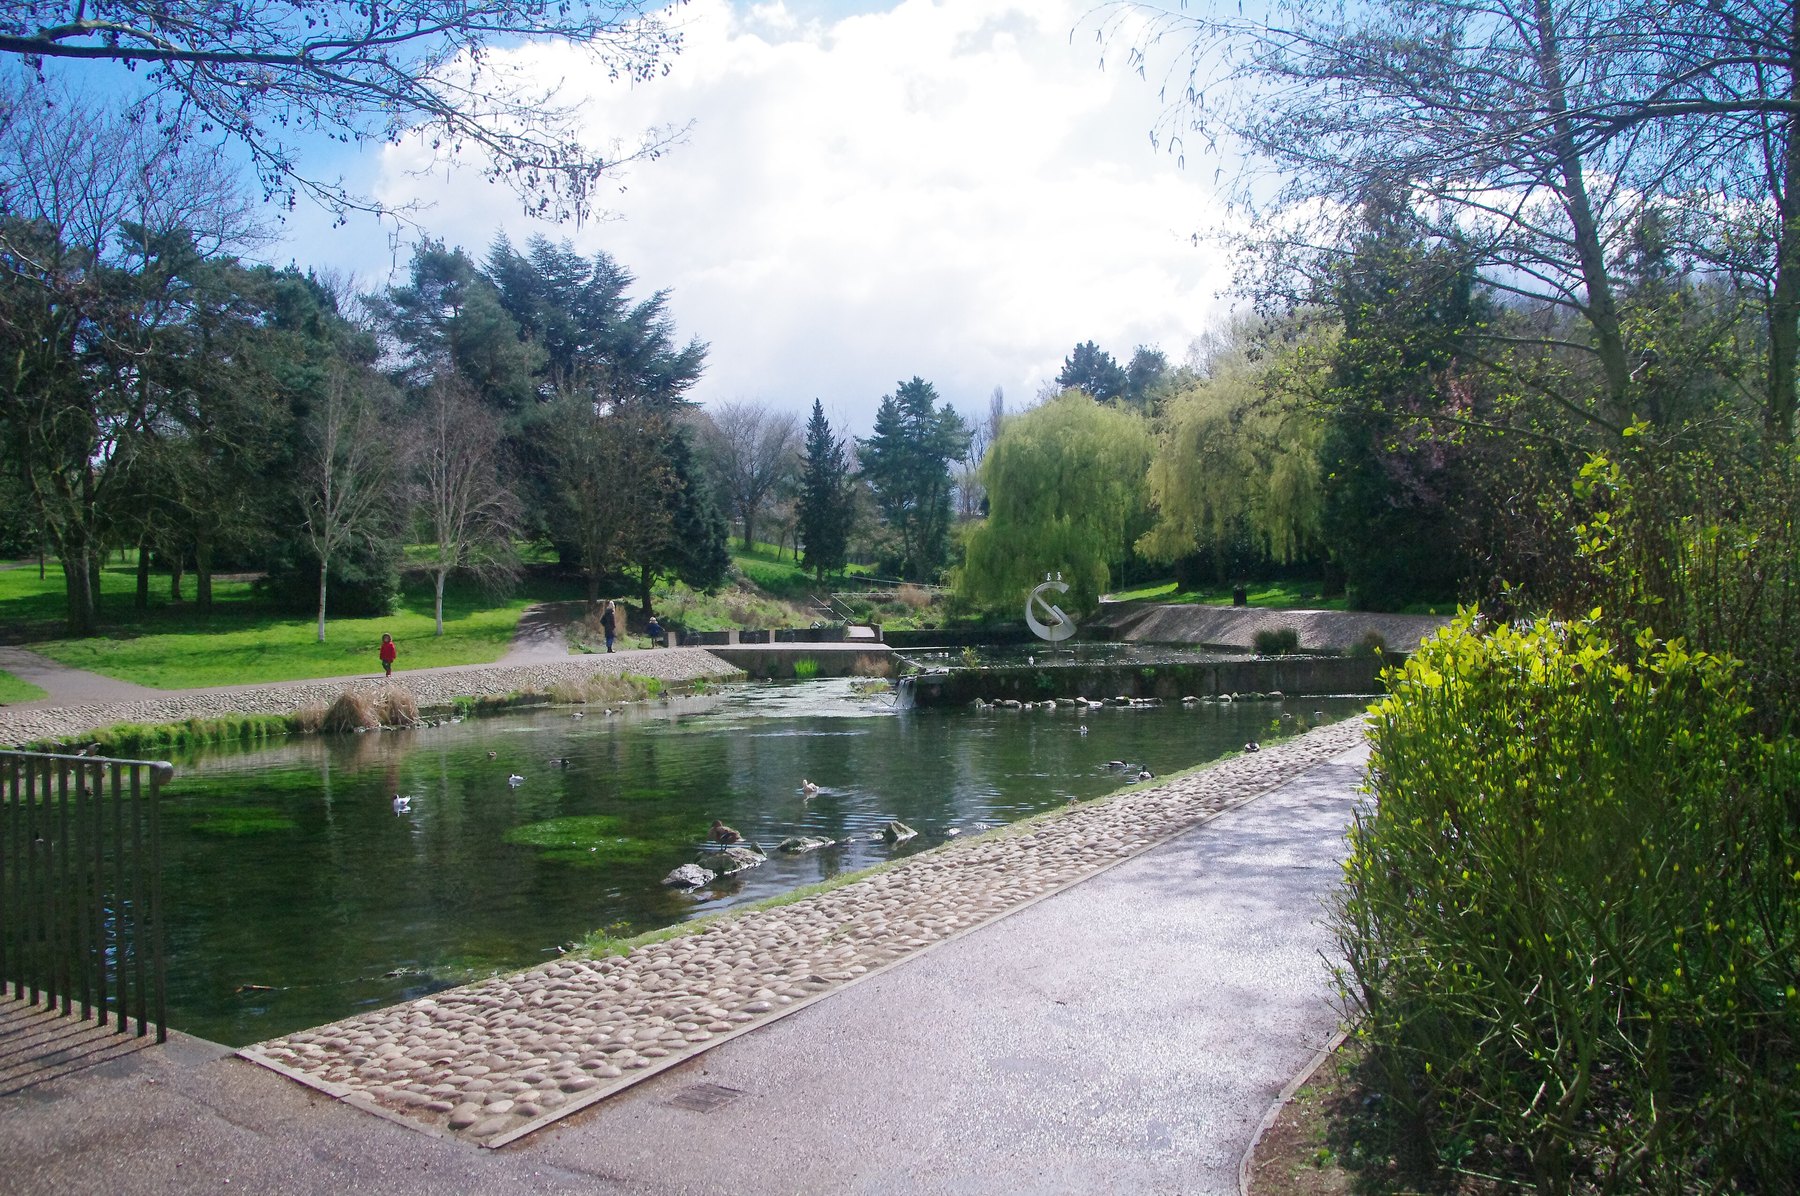

A housing market report for Harlow and postcode districts CM17, CM18, CM19 and CM20
Download the reportThe twelve months to 30 September 2026
Harlow's price did not move this year. Its volume did. The typical sale was £342,500, which is +0.7% on the twelve months before it, and the upper quartile moved −0.5%. What changed was how many homes changed hands — and a large part of that change is Land Registry still catching up rather than the market falling away.
HM Land Registry Price Paid Data, postcode districts CM17, CM18, CM19 and CM20, 1 October 2025 to 30 September 2026. Category A open-market sales only: repossessions, company transfers and other non-market sales are excluded. Downloaded 30 October 2026.
Sections 02 to 04 describe the town as a whole. Section 05 splits it by property type, and that is where most of the useful detail lives, because Harlow is a terrace market before it is anything else. Section 06 shows where the market is deep and where it thins. Sections 07 to 09 set Harlow against what it can honestly be compared with, and say plainly where a comparison is not available. Section 10 shows how far the four districts reach, which matters more here than it would in most towns. Section 11 lists what this report cannot tell you.
1 October 2025 to 30 September 2026
885 open-market sales registered across the four districts in the year, against 1,221 in the twelve months before. The median rose 0.7%. The upper quartile fell 0.5%. Both are close enough to nothing that the honest reading is a flat year on price.
| Last 12 months 1 Oct 2025 to 30 Sep 2026 | Previous 12 months 1 Oct 2024 to 30 Sep 2025 | Change | |
|---|---|---|---|
| Sales | 885 | 1,221 | −27.5% |
| Median | £342,500 | £340,000 | +0.7% |
| Mean | £375,476 | £364,833 | +2.9% |
| Lower quartile | £283,000 | £285,000 | −0.7% |
| Upper quartile | £420,000 | £422,000 | −0.5% |
| 90th percentile | £560,000 | £530,000 | +5.7% |
| Highest | £3,800,000 | £1,385,000 | +174.4% |
| Lowest | £96,000 | £51,250 | +87.3% |
Changes are our own arithmetic on the two columns beside them. The highest and lowest rows compare two single sales and move on which houses happened to trade; they are not a market movement. HM Land Registry Price Paid Data, postcode districts CM17, CM18, CM19 and CM20, 1 October 2025 to 30 September 2026. Category A open-market sales only: repossessions, company transfers and other non-market sales are excluded. Downloaded 30 October 2026.
The median sale was £342,500. The mean was £375,476, about £32,976 higher. It would be convenient to blame that gap on a handful of very large sales, and it would be wrong. Take out the single biggest sale of the year, at £3,800,000, and the mean moves by £3,874.
The gap is a broad right skew, not a few outliers: 35.6% of all sales in the year sit above the mean. Harlow has a tight middle and a long, populated upper half. A town-wide average flatters the typical Harlow sale by roughly £32,976, which is why this report leads on the median everywhere.
Price held. Volume is where the story is, and section 03 shows how much of that volume fall is registration lag rather than a market that stopped.
Leasehold looks high at 21.9% until you set it against the flat share of 22.3%. The two track each other because in Harlow leasehold is a flat tenure, not a house tenure. Of 194 leasehold sales in the year, only 6 were houses rather than flats:
| Price | Type | Street | Postcode | Registered |
|---|---|---|---|---|
| £605,000 | Detached | Hawkenbury | CM19 4HZ | 26 Nov 2025 |
| £450,000 | Semi-detached | Upper Park | CM20 1TN | 17 Apr 2026 |
| £450,000 | Semi-detached | Hawkenbury | CM19 4HZ | 13 May 2026 |
| £425,000 | Terraced | Herons Wood | CM20 1RP | 20 Feb 2026 |
| £217,500 | Terraced | Netteswell Orchard | CM20 2QW | 1 Jun 2026 |
| £190,000 | Terraced | Hornbeams | CM20 1PG | 6 Mar 2026 |
Street and postcode only. House names are on the public record but are not printed here.
The practical point for an owner: if you own a house in Harlow, leasehold is almost certainly not your question. If you own a flat, it almost certainly is, and lease length and service charge will do more to your price than the town-wide median will.
One new-build sale registered in the whole twelve months. That is the end of a long decline, not a one-year event:
| Year | 2019 | 2020 | 2021 | 2022 | 2023 | 2024 | 2025 | 2026 |
|---|---|---|---|---|---|---|---|---|
| New-build sales | 382 | 221 | 314 | 267 | 164 | 94 | 39 | 0 |
Category A sales flagged new build in the four districts. New builds register later than second-hand sales, so the most recent years are understated by more than the overall lag.
We report the shape. We do not model the cause, and this report does not tell you what is in the planning pipeline.
1 July 2026 to 30 September 2026
Land Registry records a sale when it is registered, not when it completes, and that lag runs weeks to months. July, August and September 2026 currently show 66, 44 and 27 sales against a running rate near 95 a month across January 2025 to March 2026. The most recent months are still filling as sales register, so the volumes below will rise.
Fill the quarter out at that running rate and it would hold about 285 sales rather than 137, a shortfall of roughly 148. Carry that back into the year and the −27.5% fall in section 02 becomes nearer −15.4%. Our own arithmetic on the monthly counts in this report. It is an illustration of the size of the lag, not a forecast and not a published figure.
The prices move with the volumes. 137 sales is a small sample, and the sales still to register are not spread evenly across the price range.
| Last 3 months 1 Jul 2026 to 30 Sep 2026 | Same 3 months 2025 1 Jul 2025 to 30 Sep 2025 | Change | |
|---|---|---|---|
| Sales | 137 | 306 | −55.2% |
| Median | £337,000 | £340,000 | −0.9% |
| Mean | £361,252 | £364,370 | −0.9% |
| Lower quartile | £295,000 | £293,500 | +0.5% |
| Upper quartile | £400,000 | £423,625 | −5.6% |
| Highest | £1,350,000 | £1,340,000 | +0.7% |
| Lowest | £120,000 | £95,000 | +26.3% |
Changes are our own arithmetic on the two columns beside them. Every figure in this table is drawn from a part period and will move as the remaining sales register. HM Land Registry Price Paid Data, postcode districts CM17, CM18, CM19 and CM20, 1 October 2025 to 30 September 2026. Category A open-market sales only: repossessions, company transfers and other non-market sales are excluded. Downloaded 30 October 2026.
The quarter's median of £337,000 sits −0.9% below the same quarter of 2025, and its upper quartile sits −5.6% below. On the face of it that is a softer top end. What it actually shows is which sales have reached the register so far: the lower quartile is almost unchanged at £295,000, so the cheaper half of the quarter has arrived and the dearer half has not.
What it does not show is that the market has turned. A part quarter of 137 sales, against 306 in the same quarter last year, cannot carry that conclusion, and this report does not draw it. The figure to watch is the full year in section 02, and even that carries the lag. Nothing in this section should be read as a decline.
Calendar years, 2019 to 2026
A high-volume 2021, a long slide in transactions since, and a median that has drifted up slowly the whole way through. Volume is the larger story here, not price.
| Year | Sales | Median | Mean | Lower quartile | Upper quartile |
|---|---|---|---|---|---|
| 2019 | 1,409 | £291,000 | £324,233 | £250,000 | £385,000 |
| 2020 | 1,133 | £312,000 | £340,586 | £258,500 | £400,000 |
| 2021 | 1,685 | £324,500 | £359,918 | £270,000 | £414,000 |
| 2022 | 1,395 | £330,000 | £362,384 | £281,000 | £418,000 |
| 2023 | 1,059 | £325,000 | £347,031 | £269,250 | £400,000 |
| 2024 | 1,093 | £327,000 | £351,649 | £280,000 | £400,000 |
| 2025 | 1,191 | £342,405 | £370,869 | £285,760 | £425,000 |
| 2026 to 28 Sep 2026 | 589 | £345,000 | £373,971 | £285,000 | £420,000 |
2026 is a part year to 28 September 2026 and is shown in italic. Its sales count in particular will rise as the remaining months register. HM Land Registry Price Paid Data, postcode districts CM17, CM18, CM19 and CM20, 1 October 2025 to 30 September 2026. Category A open-market sales only: repossessions, company transfers and other non-market sales are excluded. Downloaded 30 October 2026.
Open-market sales a year
Postcode districts CM17, CM18, CM19 and CM20, 2019 to 2026. The 2026 bar is a part year to 28 September 2026 and is drawn open-topped. HM Land Registry Price Paid Data, postcode districts CM17, CM18, CM19 and CM20, 1 October 2025 to 30 September 2026. Category A open-market sales only: repossessions, company transfers and other non-market sales are excluded. Downloaded 30 October 2026.
On median, 2020 to 2025 reads £312,000 to £342,405, a rise of 9.7%. Across the whole series, 2019 to 2026 to date, the rise is 18.6%. Both are our own arithmetic on two figures from the table above, not a published index.
The half-year series is the cleanest view of the price trend, because it smooths the month-to-month noise without hiding a turn. Harlow's has traded inside a band of roughly £313,000 to £346,000 for five and a half years.
Half-year median sale price
Postcode districts CM17, CM18, CM19 and CM20, 2021 H1 to 2026 H2. The closing segment is a part period and is drawn as one. HM Land Registry Price Paid Data, postcode districts CM17, CM18, CM19 and CM20, 1 October 2025 to 30 September 2026. Category A open-market sales only: repossessions, company transfers and other non-market sales are excluded. Downloaded 30 October 2026.
| Period | Median | Sales | Period | Median | Sales |
|---|---|---|---|---|---|
| 2021 H1 | £330,000 | 987 | 2024 H1 | £325,000 | 467 |
| 2021 H2 | £313,000 | 698 | 2024 H2 | £335,000 | 626 |
| 2022 H1 | £325,050 | 639 | 2025 H1 | £346,000 | 589 |
| 2022 H2 | £335,000 | 756 | 2025 H2 | £340,000 | 602 |
| 2023 H1 | £329,500 | 514 | 2026 H1 | £345,000 | 452 |
| 2023 H2 | £320,000 | 545 | 2026 H2 | £337,000 | 137, part period |
The closing period is a part period to 28 September 2026. HM Land Registry Price Paid Data, postcode districts CM17, CM18, CM19 and CM20, 1 October 2025 to 30 September 2026. Category A open-market sales only: repossessions, company transfers and other non-market sales are excluded. Downloaded 30 October 2026.
1,685 sales registered in 2021. The settled run rate since is nearer 1,110 a year, and 2026 stands at 589 with the last three months still filling. Harlow is pricing a little higher on materially fewer transactions than it did five years ago, and that matters more to anyone deciding when to sell than a median that has moved +0.7% in twelve months.
One month in the series does not belong to the trend. March 2025 registered 207 sales against a running rate near 95. The stamp duty nil-rate band in force from April 2025 is £125,000, and £300,000 for first-time buyers. We report the spike as observed and do not model its cause.
By property type, last 12 months
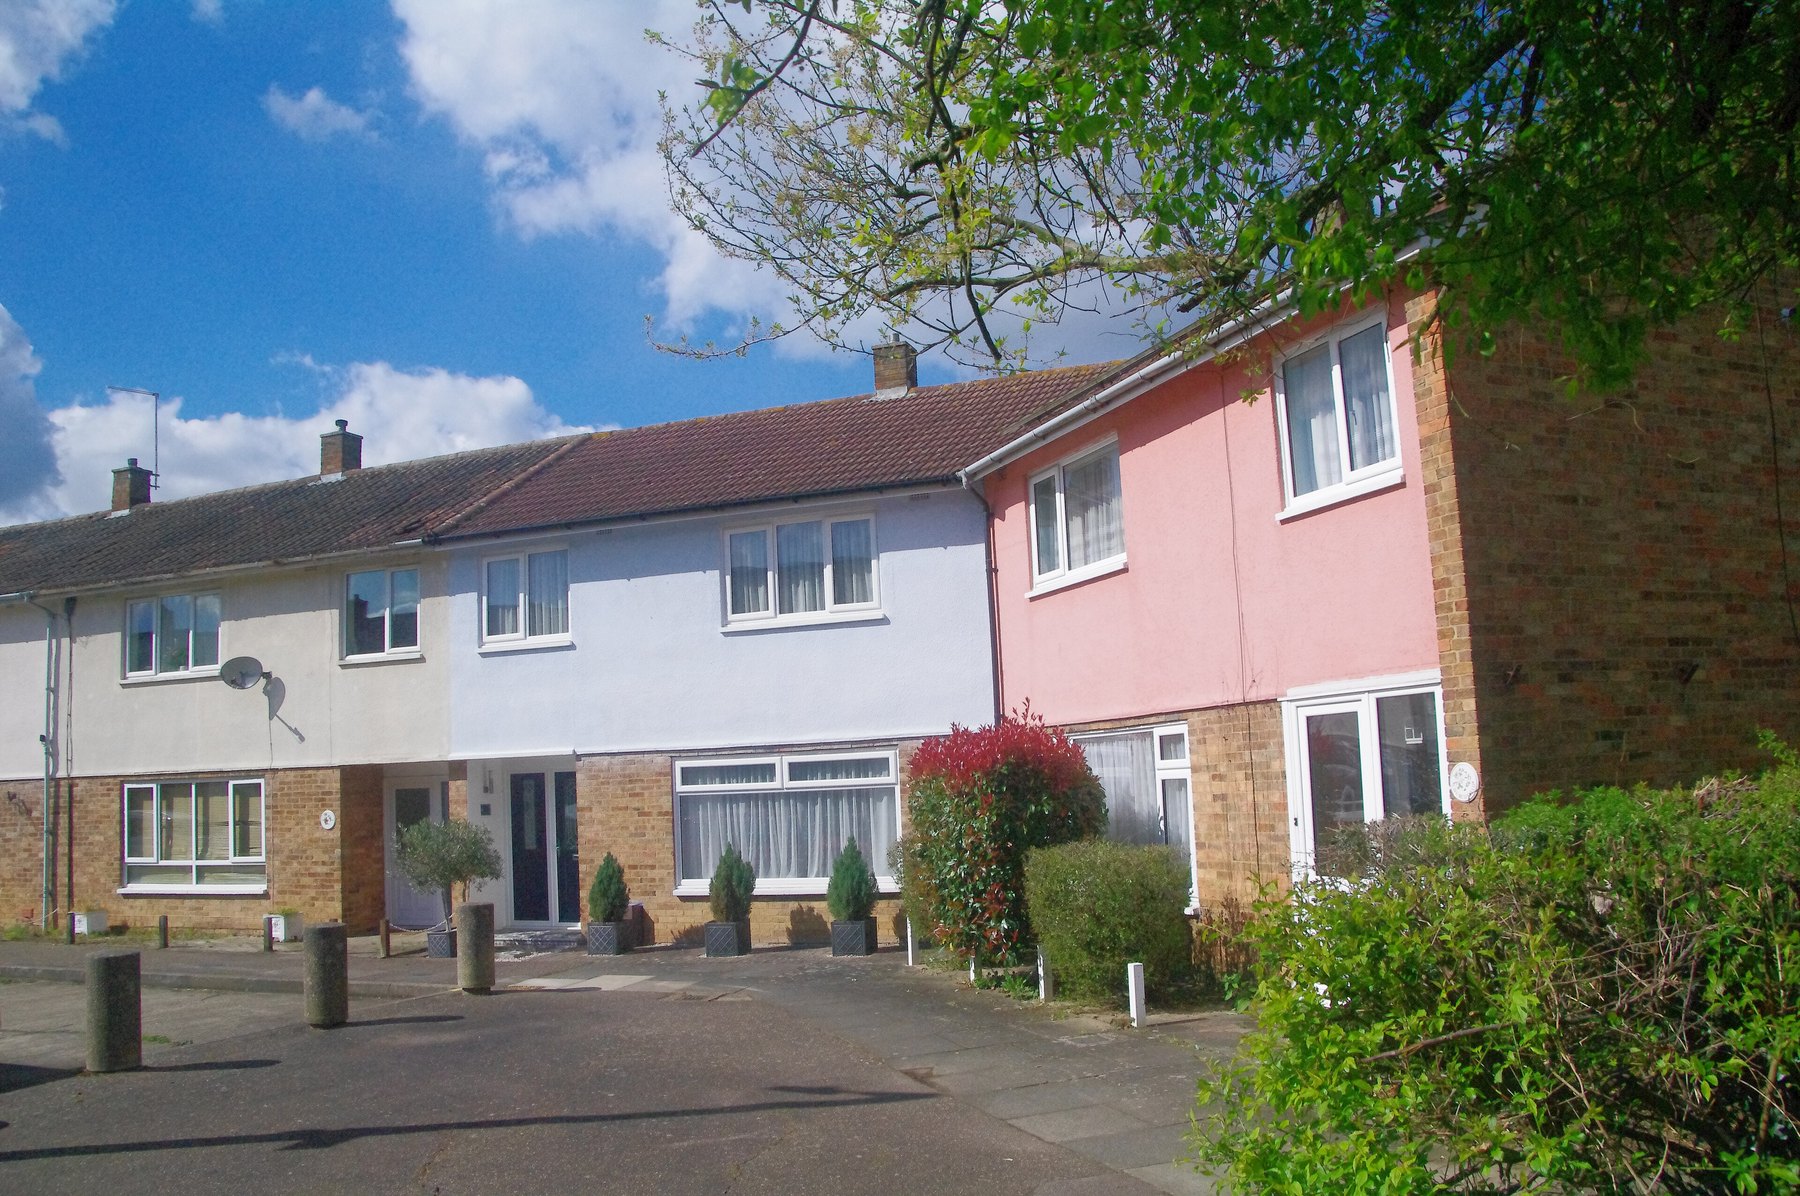
Harlow is a terrace market before it is anything else. Terraced houses are 47.3% of every sale in the town — nearly half — and flats and maisonettes are another 22.3%. Detached homes are only 15.4% of sales and set the top of the market. Any town-wide figure for Harlow is mostly a statement about terraces.
| Type | Sales | Share | Median | Mean | Lower quartile | Upper quartile | Median change |
|---|---|---|---|---|---|---|---|
| Detached | 136 | 15.4% | £560,000 | £640,601 | £465,000 | £678,750 | +5.3% |
| Semi-detached | 133 | 15.0% | £425,000 | £448,438 | £387,000 | £490,000 | +2.4% |
| Terraced | 419 | 47.3% | £335,000 | £339,112 | £310,000 | £368,000 | 0.0% |
| Flat / maisonette | 197 | 22.3% | £220,000 | £220,532 | £183,000 | £247,000 | +4.8% |
The change column compares the median with the previous twelve months, when detached £532,000 on 187 sales; semi-detached £415,000 on 197 sales; terraced £335,000 on 583 sales; flat £210,000 on 254 sales. It is our own arithmetic on those two medians. HM Land Registry Price Paid Data, postcode districts CM17, CM18, CM19 and CM20, 1 October 2025 to 30 September 2026. Category A open-market sales only: repossessions, company transfers and other non-market sales are excluded. Downloaded 30 October 2026.
Median by property type
Postcode districts CM17, CM18, CM19 and CM20. Last twelve months against the previous twelve. HM Land Registry Price Paid Data, postcode districts CM17, CM18, CM19 and CM20, 1 October 2025 to 30 September 2026. Category A open-market sales only: repossessions, company transfers and other non-market sales are excluded. Downloaded 30 October 2026.
Detached moved from £532,000 to £560,000. Terraced read £335,000 in both years — the same figure, to the pound, on 419 sales this year and 583 last.
Terraced is 47.3% of the Harlow market. A flat terraced median is close to a flat town.
Some of it, and it has to be said. Detached volume fell from 187 sales to 136, −27.3%%. Over the same twelve months the detached upper quartile moved from £625,000 to £678,750 and the highest detached sale moved from £1,385,000 to £3,800,000. Fewer detached houses traded, and the ones that did reached further up the range — which lifts a median without any individual house being worth more.
What the mix argument does not explain away is the contrast. Terraced volume fell too, from 583 to 419, and the terraced median did not move by a pound. Flats fell from 254 to 197 and their median still rose 4.8%. The three types saw a similar fall in transactions and three different price outcomes.
The practical point for an owner. A Harlow detached valuation and a Harlow terrace valuation are now moving on different evidence and should not be set off the same town-wide figure. If you own a terrace, the honest comparable set is the 419 terraced sales in this table, and it says your price is where it was a year ago. If you own a detached house, the set is 136 sales and it is thinner, more spread, and more dependent on which houses happen to be on the market the week yours is.
The four districts, last 12 months
This report publishes a town median of £342,500. It should not be read without this page beside it. The four districts are different markets, and the gap between the dearest and the cheapest is £79,250, or 24.7%.
| District | Sales | Median | Median change | Lower quartile | Upper quartile | Sales at £750k+ | Leasehold |
|---|---|---|---|---|---|---|---|
| CM17 | 330 | £400,000 | 0.0% | £325,000 | £488,750 | 14 | 18.5% |
| CM18 | 210 | £320,750 | −1.3% | £280,000 | £364,500 | 3 | 14.8% |
| CM19 | 151 | £342,500 | −1.0% | £282,500 | £426,500 | 6 | 17.9% |
| CM20 | 194 | £325,000 | +3.2% | £225,375 | £364,875 | 4 | 38.7% |
Median change compares each district with the same twelve months a year earlier and is our own arithmetic. Sales counts carry the registration lag described in section 03. HM Land Registry Price Paid Data, postcode districts CM17, CM18, CM19 and CM20, 1 October 2025 to 30 September 2026. Category A open-market sales only: repossessions, company transfers and other non-market sales are excluded. Downloaded 30 October 2026.
The widest gap is CM17 against CM18: £400,000 against £320,750, a difference of £79,250, or 24.7%. CM17 against CM19 is narrower — £57,500, or 16.8%. If you came to this report expecting the east to west spread to be the headline, the east to south spread is wider.
The reason is in the type mix below rather than in the land. CM17 is 27.3% detached and 31.5% terraced. CM18 is 5.7% detached and 68.6% terraced. CM20 is 37.6% flats, the highest of the four, which also explains its lower quartile of £225,375 — the lowest of the four by a distance.
| District | Detached share | Semi-detached share | Terraced share | Flat share | Detached median | Semi-detached median | Terraced median | Flat median |
|---|---|---|---|---|---|---|---|---|
| CM17 | 27.3% | 21.8% | 31.5% | 19.4% | £540,000 | £440,000 | £354,000 | £237,500 |
| CM18 | 5.7% | 10.0% | 68.6% | 15.7% | £637,500 | £410,000 | £325,000 | £191,000 |
| CM19 | 15.2% | 17.2% | 49.7% | 17.9% | £560,000 | £431,500 | £335,000 | £175,000 |
| CM20 | 5.7% | 7.2% | 49.5% | 37.6% | £610,000 | £408,750 | £336,954 | £200,000 |
Shares and medians are by property type within each district, last twelve months. A dash means no sale of that type registered in that district in the window. HM Land Registry Price Paid Data, postcode districts CM17, CM18, CM19 and CM20, 1 October 2025 to 30 September 2026. Category A open-market sales only: repossessions, company transfers and other non-market sales are excluded. Downloaded 30 October 2026.
Distribution, last 12 months
Two in three Harlow sales land between £250,000 and £500,000. The market is deep in the middle and thin at both ends, which is the opposite shape to the towns around it.
Share of sales by price band
Postcode districts CM17, CM18, CM19 and CM20, 1 October 2025 to 30 September 2026. 885 sales. HM Land Registry Price Paid Data, postcode districts CM17, CM18, CM19 and CM20, 1 October 2025 to 30 September 2026. Category A open-market sales only: repossessions, company transfers and other non-market sales are excluded. Downloaded 30 October 2026.
| Band | Sales | Share of all sales |
|---|---|---|
| Under £250,000 | 163 | 18.4% |
| £250,000 to £350,000 | 297 | 33.6% |
| £350,000 to £500,000 | 303 | 34.2% |
| £500,000 to £750,000 | 95 | 10.7% |
| £750,000 to £1m | 15 | 1.7% |
| £1m and above | 12 | 1.4% |
Shares are our own arithmetic on the counts beside them against the 885 sales in the window. HM Land Registry Price Paid Data, postcode districts CM17, CM18, CM19 and CM20, 1 October 2025 to 30 September 2026. Category A open-market sales only: repossessions, company transfers and other non-market sales are excluded. Downloaded 30 October 2026.
Harlow has real depth from £250,000 to £500,000: 600 sales in the year, 67.8% of everything that traded (our own arithmetic on the two bands above). Price inside that range and you are in a market of hundreds of buyers and hundreds of comparables, where a guide price that is five per cent wrong will be corrected by the market within a fortnight.
Above £500,000 the market thins fast. The £500,000 to £750,000 band holds 95 sales, 10.7%. Above £750,000 there are 27 sales in a whole year, 3.1% of the market, and above £1,000,000 there are 12. A home priced above £750,000 in Harlow is competing in a market of tens rather than hundreds, and the evidence available to price it is correspondingly thin. That is not a reason to under-price it. It is a reason to expect a longer campaign and to treat any single comparable with suspicion.
At the other end, 163 sales — 18.4% — went below £250,000. That band is almost entirely flats; it is not a band of cheap houses.
Essex, labelled as such
There is no reliable Harlow figure for pounds per square foot in open data. Land Registry Price Paid Data carries no floor area, so one cannot be derived from the 885 sales in this report. The town-level source was checked and has no Harlow page.
The figures below are Essex county figures. They are not Harlow figures and this report does not present them as such.
Plumplot, Essex house prices per square metre, derived from HM Land Registry Price Paid Data. plumplot.co.uk/Essex-house-prices-per-square-metre.html, fetched 30 October 2026. · October 2025 to September 2026
Land Registry Price Paid Data carries no floor area, so no Harlow rate can be derived from the sales in this report. The town-level source was checked and returns nothing for Harlow. The figures given are Essex county rates, labelled as county rates.
Harlow's median sits below the Essex average on the comparison in section 09, and its stock is weighted towards terraces and flats rather than the detached houses that lift a county rate. On that reasoning a Harlow rate would most likely sit below £393 a square foot for houses. This report does not put a number on it, because any number it printed would be an estimate dressed as a measurement, and it would be quoted back at us as though it were measured.
For the direction of travel, the same source puts Essex at £4.1k per square metre in 2026 against £4.2k in 2025, and England and Wales at £3.6k in 2026. The county rate is broadly flat and sits above the national one.
Homes above £750,000
27 homes sold at £750,000 or more across the four districts in the twelve months to 30 September 2026. That is 3.1% of all sales — about one in 32. This is a thin segment and this report reports it as one.
| Last 12 months | Previous 12 months | |
|---|---|---|
| Sales | 27 | 27 |
| Share of all sales | 3.1% | 2.2% |
| Median | £945,000 | £910,000 |
| Mean | £1,136,204 | £978,528 |
| Lower quartile | £860,000 | £836,250 |
| Upper quartile | £1,175,000 | £1,075,000 |
| 90th percentile | £1,390,000 | £1,311,600 |
| Highest | £3,800,000 | £1,385,000 |
| Lowest | £760,000 | £750,000 |
| Type | Sales | Share of segment | Median |
|---|---|---|---|
| Detached | 26 | 96.3% | £945,000 |
| Semi-detached | 1 | 3.7% | £1,350,000 |
| District | Sales | Median |
|---|---|---|
| CM17 | 14 | £985,000 |
| CM18 | 3 | £900,000 |
| CM19 | 6 | £1,062,500 |
| CM20 | 4 | £945,000 |
No change column is given on the segment table. With 27 sales in each year a percentage change on a median would move on which two houses happened to trade, and would read as a market movement when it is not one. The two columns are set side by side for comparison, not for arithmetic. HM Land Registry Price Paid Data, postcode districts CM17, CM18, CM19 and CM20, 1 October 2025 to 30 September 2026. Category A open-market sales only: repossessions, company transfers and other non-market sales are excluded. Downloaded 30 October 2026.
They are in the Epping Forest and East Hertfordshire parishes that CM17, CM19 and CM20 reach into — Matching Green, Hastingwood, Roydon, Gilston. Eight of the twelve highest sales in the year sit outside Harlow district too.
Harlow's high-value market is substantially a village market carried on a Harlow postcode. Section 10 shows how far those districts reach.
The segment is also almost entirely one property type. 26 of the 27 sales were detached — 96.3% — and only 1 was not. In twelve months not one terraced house and not one flat in the four districts sold at £750,000 or more. In a town where terraces and flats are 69.6% of all sales — our own arithmetic on the two shares in section 05 — the high-value segment is not a slice of the Harlow market so much as a different market entirely.
Share of all sales at £750,000 and above
Postcode districts CM17, CM18, CM19 and CM20, 2019 to 2026. The 2026 bar is a part year to 28 September 2026 and is drawn open-topped. HM Land Registry Price Paid Data, postcode districts CM17, CM18, CM19 and CM20, 1 October 2025 to 30 September 2026. Category A open-market sales only: repossessions, company transfers and other non-market sales are excluded. Downloaded 30 October 2026.
| Year | Sales at £750k and above | Share of all sales | Median | Mean |
|---|---|---|---|---|
| 2019 | 25 | 1.8% | £855,000 | £905,500 |
| 2020 | 23 | 2.0% | £842,500 | £977,717 |
| 2021 | 47 | 2.8% | £925,000 | £1,029,808 |
| 2022 | 40 | 2.9% | £911,250 | £987,575 |
| 2023 | 18 | 1.7% | £848,250 | £929,250 |
| 2024 | 20 | 1.8% | £897,500 | £973,850 |
| 2025 | 29 | 2.4% | £950,000 | £1,100,302 |
| 2026 to 28 Sep 2026 | 20 | 3.4% | £932,500 | £1,019,125 |
2026 is a part year to 28 September 2026. Medians and means on counts this small move on individual sales. HM Land Registry Price Paid Data, postcode districts CM17, CM18, CM19 and CM20, 1 October 2025 to 30 September 2026. Category A open-market sales only: repossessions, company transfers and other non-market sales are excluded. Downloaded 30 October 2026.
The segment's median has moved inside a band between £842,500 and £950,000 across eight years and reads £932,500 now. Its share of all sales has gone from 1.8% in 2019 to 3.4% in 2026 to date — but the 2026 figure is a part year on a small base, and a single extra registration moves it. Read the share column as a drift upward, not as a trend you could price off.
| Price | Street | Postcode | Registered | Type |
|---|---|---|---|---|
| £3,800,000 | Little Laver Road | CM17 0RJ | 31 Oct 2025 | Detached |
| £1,900,000 | Potash Road | CM17 0RN | 19 Feb 2026 | Detached |
| £1,450,000 | Gilston Park | CM20 2RG | 5 Dec 2025 | Detached |
| £1,350,000 | Hastingwood Road | CM17 9JN | 4 Sep 2026 | Semi-detached |
| £1,235,000 | Langland Place | CM19 5FS | 19 Jun 2026 | Detached |
| £1,215,000 | Rectory Lane | CM19 4HA | 18 Dec 2025 | Detached |
| £1,200,000 | Mulberry Green | CM17 0EY | 19 Feb 2026 | Detached |
| £1,150,000 | Rye Hill Road | CM18 7JE | 31 Oct 2025 | Detached |
| £1,135,000 | Epping Road | CM19 5DD | 14 Oct 2025 | Detached |
| £1,125,000 | Sheering Road | CM17 0JN | 8 Sep 2026 | Detached |
| £1,075,000 | London Road | CM17 9LH | 22 Apr 2026 | Detached |
| £1,050,000 | Hastingwood Road | CM17 9JL | 27 Mar 2026 | Detached |
Street and postcode only. House names are on the public record but are not printed here. Dates are registration dates, not completion dates. HM Land Registry Price Paid Data, postcode districts CM17, CM18, CM19 and CM20, 1 October 2025 to 30 September 2026. Category A open-market sales only: repossessions, company transfers and other non-market sales are excluded. Downloaded 30 October 2026.
27 sales in a year, 3.1% of the market, and 18 of them outside Harlow district. If you are selling a large house on a Harlow postcode, your buyer pool is not the Harlow market described in sections 02 to 06 — it is a separate, smaller market that happens to share a postal town. The comparable evidence for it is the table above and the 27 sales behind it, and that is the whole of it.
What this report cannot tell you is how long any of those took to sell, or what they were asking before they sold. Neither is in the record we are using. Section 11 lists that gap alongside the others.
Against the county, the region and the country
Harlow's median of £342,500 sits against an Essex average of £359,433 and an England average of £293,525. The typical Harlow home is worth roughly 1.17 times the England figure and a little below the Essex one — which already tells you most of what you need to know about where Harlow sits.
| Area | Figure | Measure | Change on the year | Period | Source |
|---|---|---|---|---|---|
| Harlow, CM17 to CM20 | £342,500 | Median | +0.7% | 1 Oct 2025 to 30 Sep 2026 | This report |
| Harlow district (local authority) | £317,453 | Average | +4.3% | August 2026 | UK House Price Index |
| Essex | £359,433 | Average | −0.3% | August 2026 | UK House Price Index |
| East of England | £337,848 | Average | +0.2% | August 2026 | UK House Price Index |
| England | £293,525 | Average | +0.4% | August 2026 | UK House Price Index |
| United Kingdom | £273,037 | Average | +0.9% | August 2026 | UK House Price Index |
UK HPI figures are mix-adjusted AVERAGE prices for August 2026. Ours is a raw MEDIAN of actual sales over twelve months. Different measure, different period. HM Land Registry UK House Price Index, August 2026 release, full file UK-HPI-full-file-2026-08.csv, last modified 21 October 2026, downloaded 30 October 2026.
Ours is a median, the comparators are averages. A median is the middle sale of the set. An average is the arithmetic mean of all of them, and in a market with a long upper half it sits above the median. Harlow's own mean, £375,476, is about £32,976 above its own median.
So the ratios above are an order of magnitude, not precise multiples. Compared mean to mean, the gap between Harlow and England would be wider than 1.17 times, not narrower.
The UK House Price Index reads £317,453 for Harlow district, +4.3% on the year. This report reads £342,500, +0.7% on the year. Neither is wrong. The index is a mix-adjusted average for a single month over the local authority; ours is a raw median of actual sales over twelve months over four postcode districts, 59 of which fall outside the local authority. Different measure, different period, different boundary. We set them beside each other rather than reconciling them.
| Type | Essex average, Aug 2026 | Harlow median, last 12 months |
|---|---|---|
| Detached | £576,858 | £560,000 |
| Semi-detached | £377,574 | £425,000 |
| Terraced | £310,845 | £335,000 |
| Flat / maisonette | £188,939 | £220,000 |
County figures are UK House Price Index averages for August 2026. Harlow figures are Land Registry medians for the twelve months to 30 September 2026. The two are different measures over different periods and are set side by side for scale, not for arithmetic. HM Land Registry UK House Price Index, August 2026 release, full file UK-HPI-full-file-2026-08.csv, last modified 21 October 2026, downloaded 30 October 2026.
Unlike the county and national rows above, every figure in this table is our own, computed from the same Land Registry download, the same twelve-month window and the same Category A filter, selected on the Land Registry post town field. Nothing here is borrowed from a third-party summary.
| Town | Median | Sales in the window |
|---|---|---|
| Epping | £536,000 | 262 |
| Hertford | £450,000 | 491 |
| Bishop's Stortford | £440,000 | 733 |
| Sawbridgeworth | £430,000 | 129 |
| Chelmsford | £402,500 | 2,152 |
| Harlow | £342,500 | 885 |
Selected on the HM Land Registry post town field, 1 October 2025 to 30 September 2026, Category A only. Harlow is the four districts in this report.
Harlow is the cheapest of the six by some distance: £342,500 against £440,000 in Bishop's Stortford, £430,000 in Sawbridgeworth and £536,000 in Epping. The gap to Epping is £193,500, or 56% — and Epping is twenty minutes away on the same railway line. For a vendor, that gap is the argument for Harlow as a place buyers move to; for a buyer it is the reason they do.
All six medians are our own, computed from the same HM Land Registry Price Paid Data download, Category A only, same twelve-month window, selected on the Land Registry post town field. Harlow is the four districts in this report. Our own arithmetic on the medians in the table above.
Postcode districts CM17, CM18, CM19 and CM20
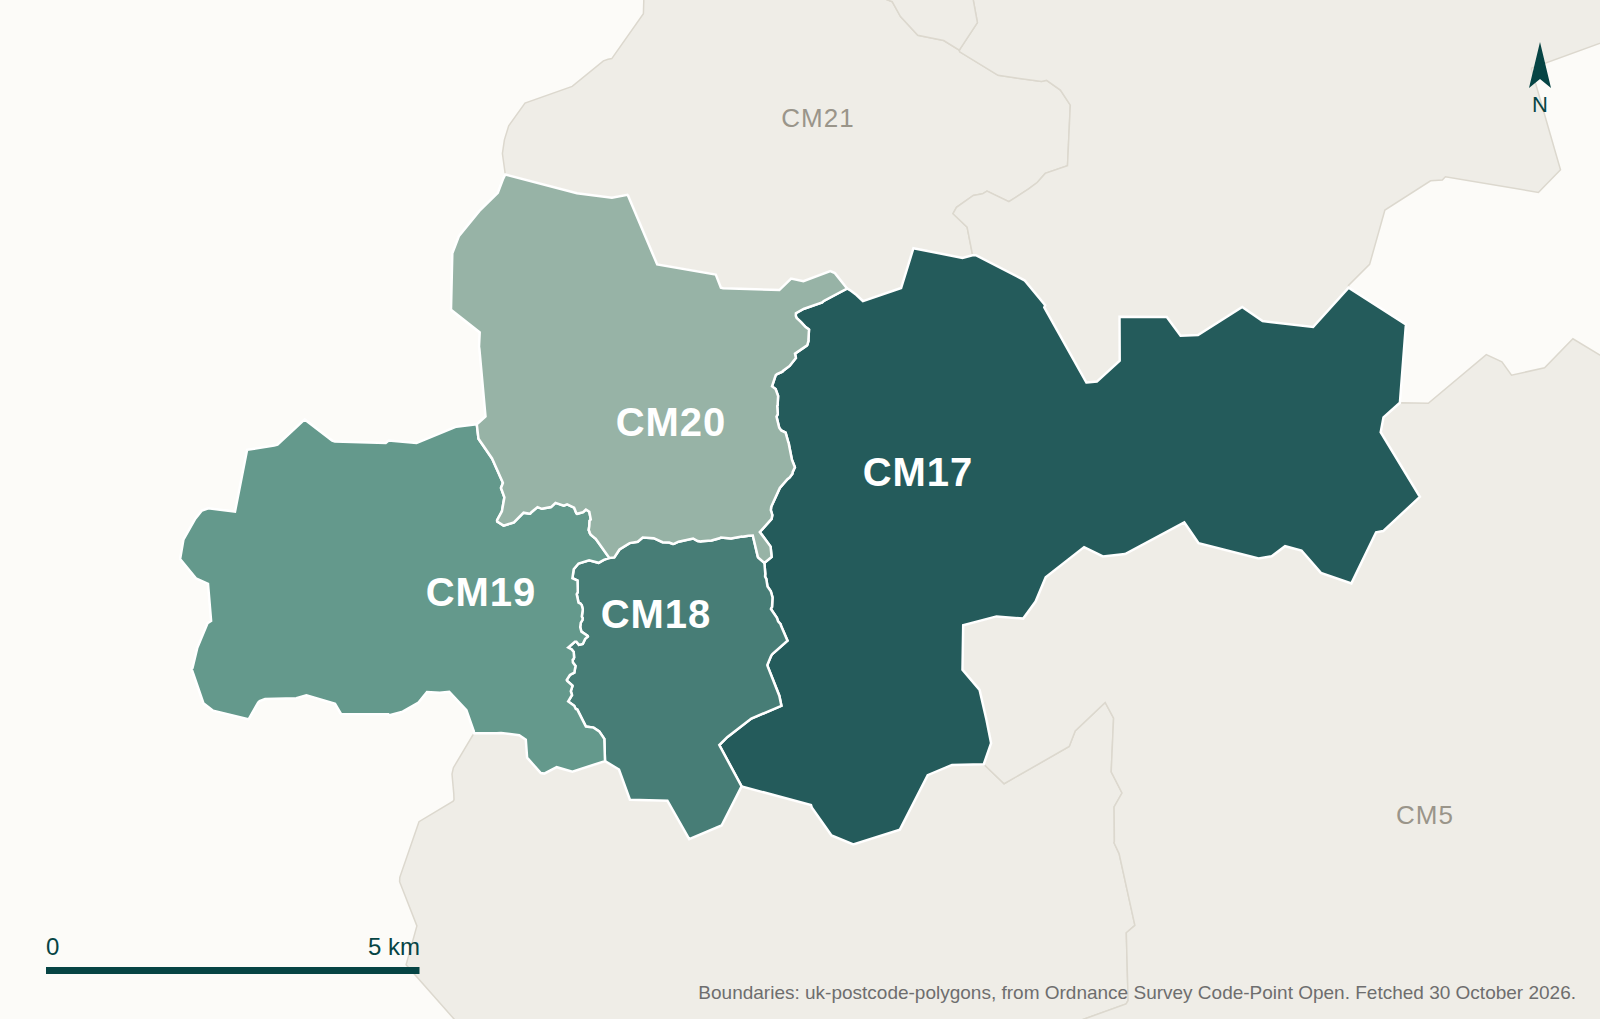
Every one of the 9,554 Land Registry transactions recorded in these four districts since January 2019 carries the post town HARLOW, so for this report the post town and the four postcode districts are the same area. They are not the same area as Harlow district council. 59 of the 885 sales in the last twelve months — 6.7% — fall outside the Harlow local authority altogether — our own arithmetic on those two counts.
Local authority counts across the whole 2019-to-2026 record: CM17 — Harlow 3,568, Epping Forest 189. CM18 — Harlow 2,022. CM19 — Harlow 1,342, Epping Forest 210. CM20 — Harlow 2,093, East Hertfordshire 122. Source: the HM Land Registry local authority district field carried on each sale.
How this report was built
The sales figures in this report come from HM Land Registry Price Paid Data, the complete annual bulk files for 2019 to 2026, downloaded on 30 October 2026 and filtered to postcode districts CM17, CM18, CM19 and CM20.
Those four districts hold 11,168 transactions since January 2019. This report uses the 9,554 of them recorded as PPD category A, standard open-market sales. The remaining 1,614 — repossessions, company transfers, transfers to a non-private individual, buy-to-lets and other non-market transactions — are excluded. That is why these figures run below the ones the portals publish. Deleted records are excluded too.
Land Registry records a sale when it registers rather than when it completes, so the most recent months are still filling and their volumes will rise. Every table drawn from a part period says so. Where a figure comes from somewhere else, it is named beside it on the page.
Percentages described as our own arithmetic are calculated from two figures that are both printed in the tables on the page where the percentage appears. No index, no model, no seasonal adjustment and no weighting has been applied to anything computed here.
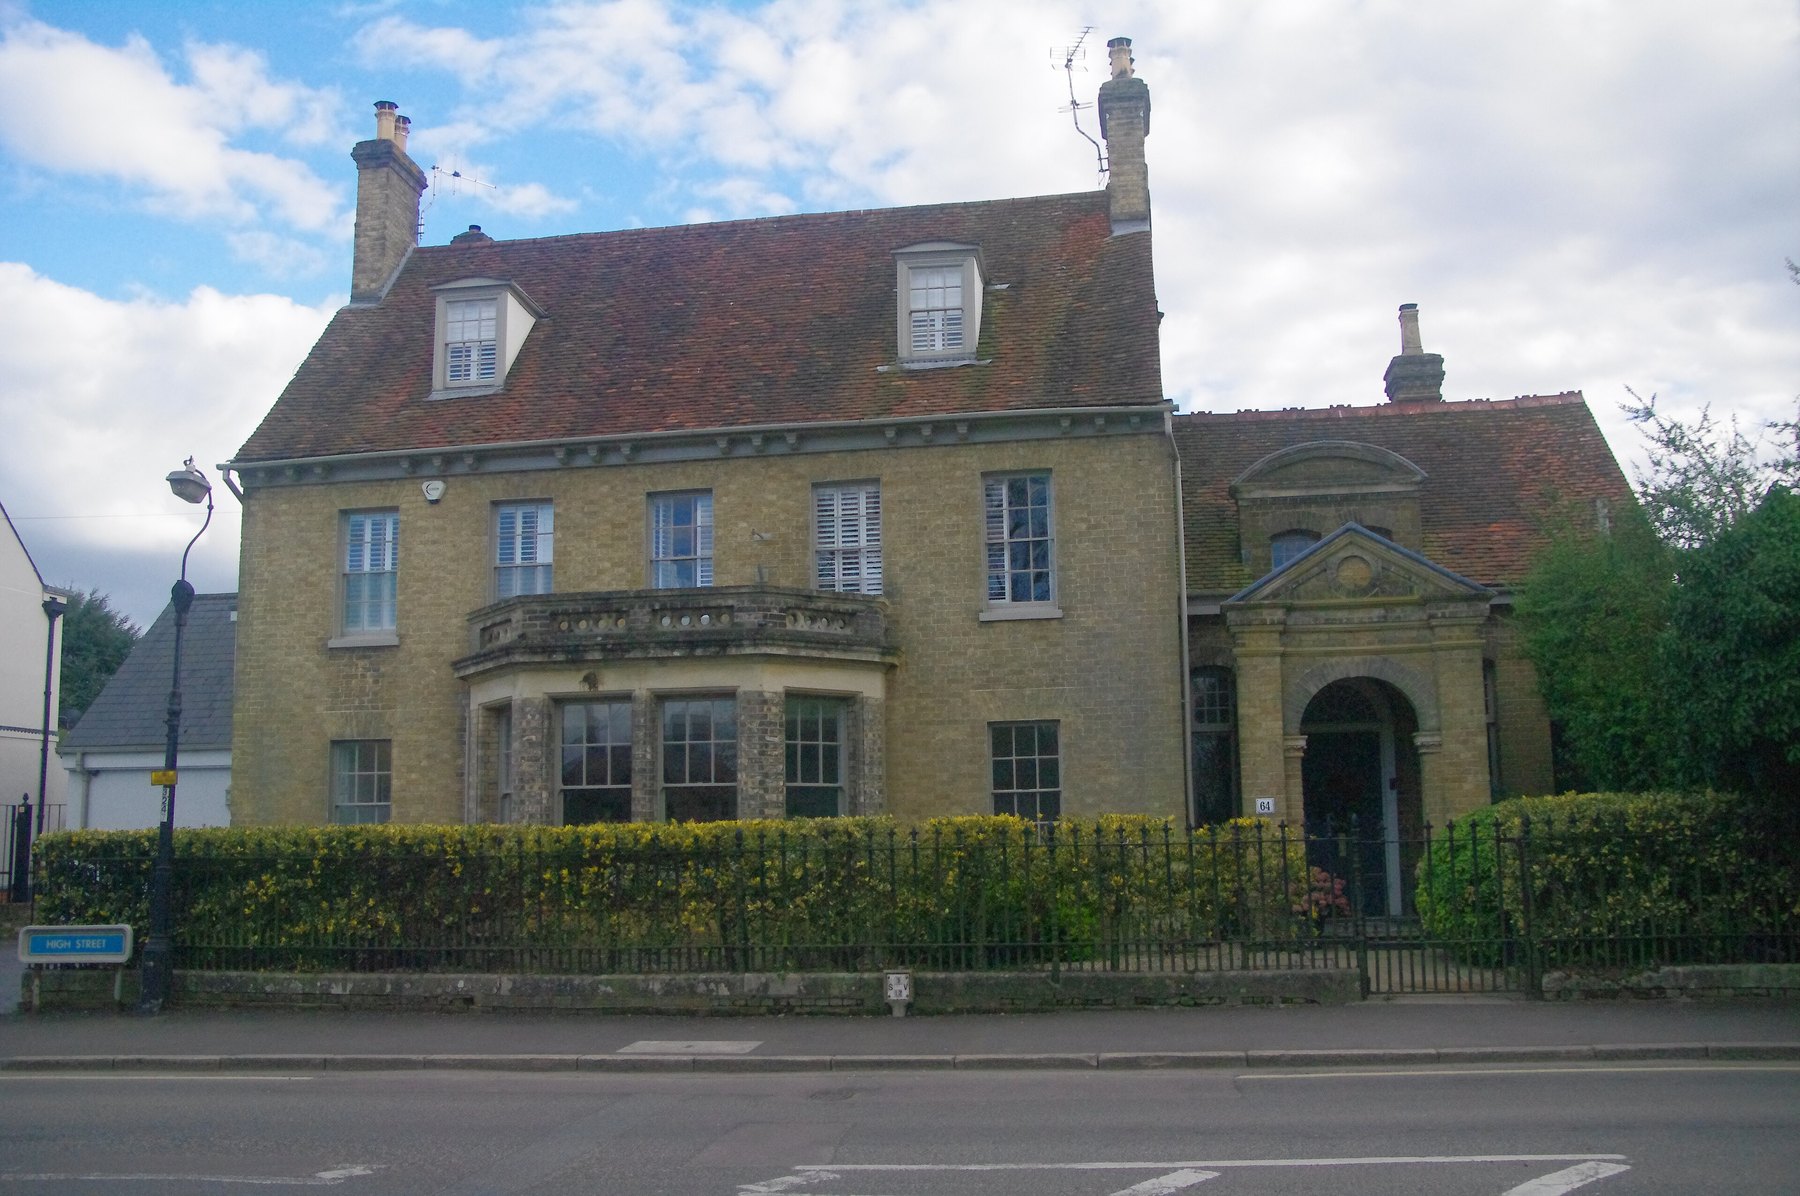
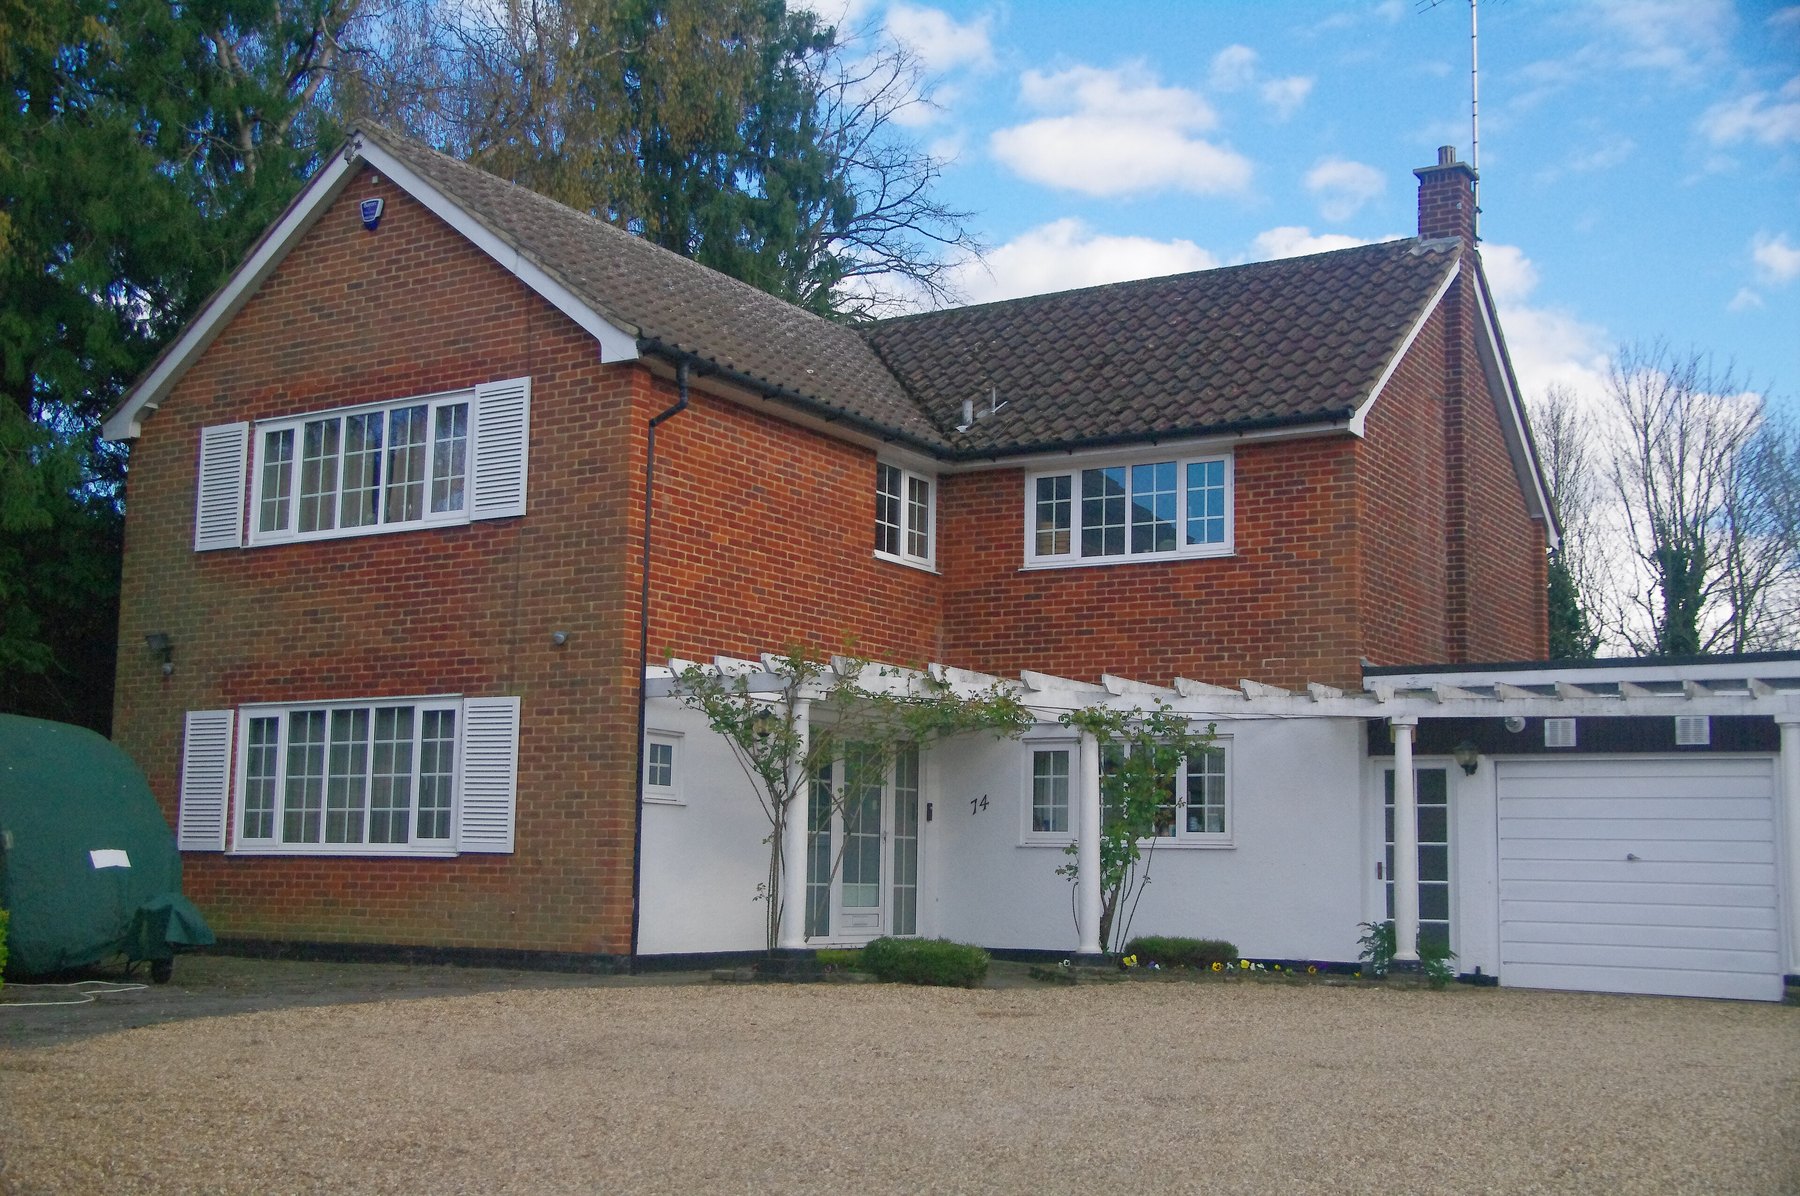
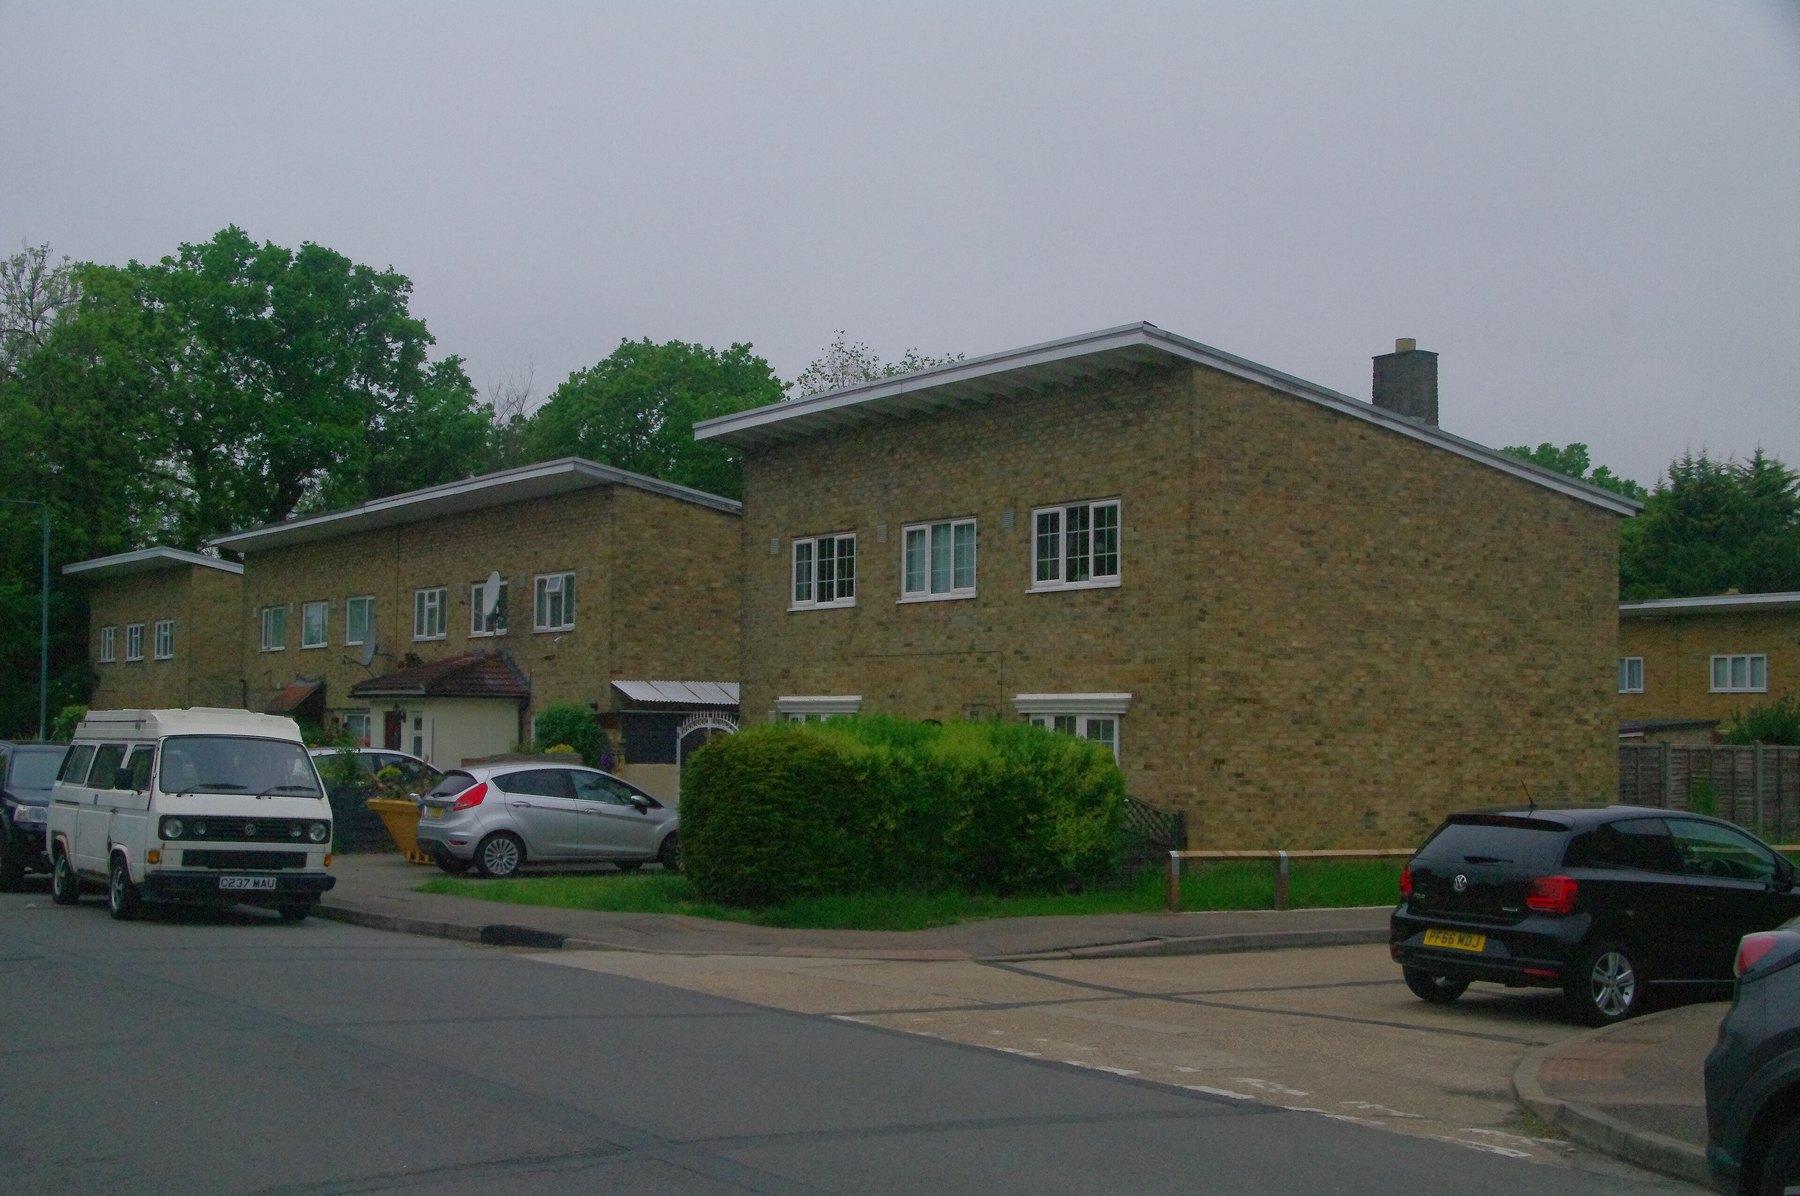
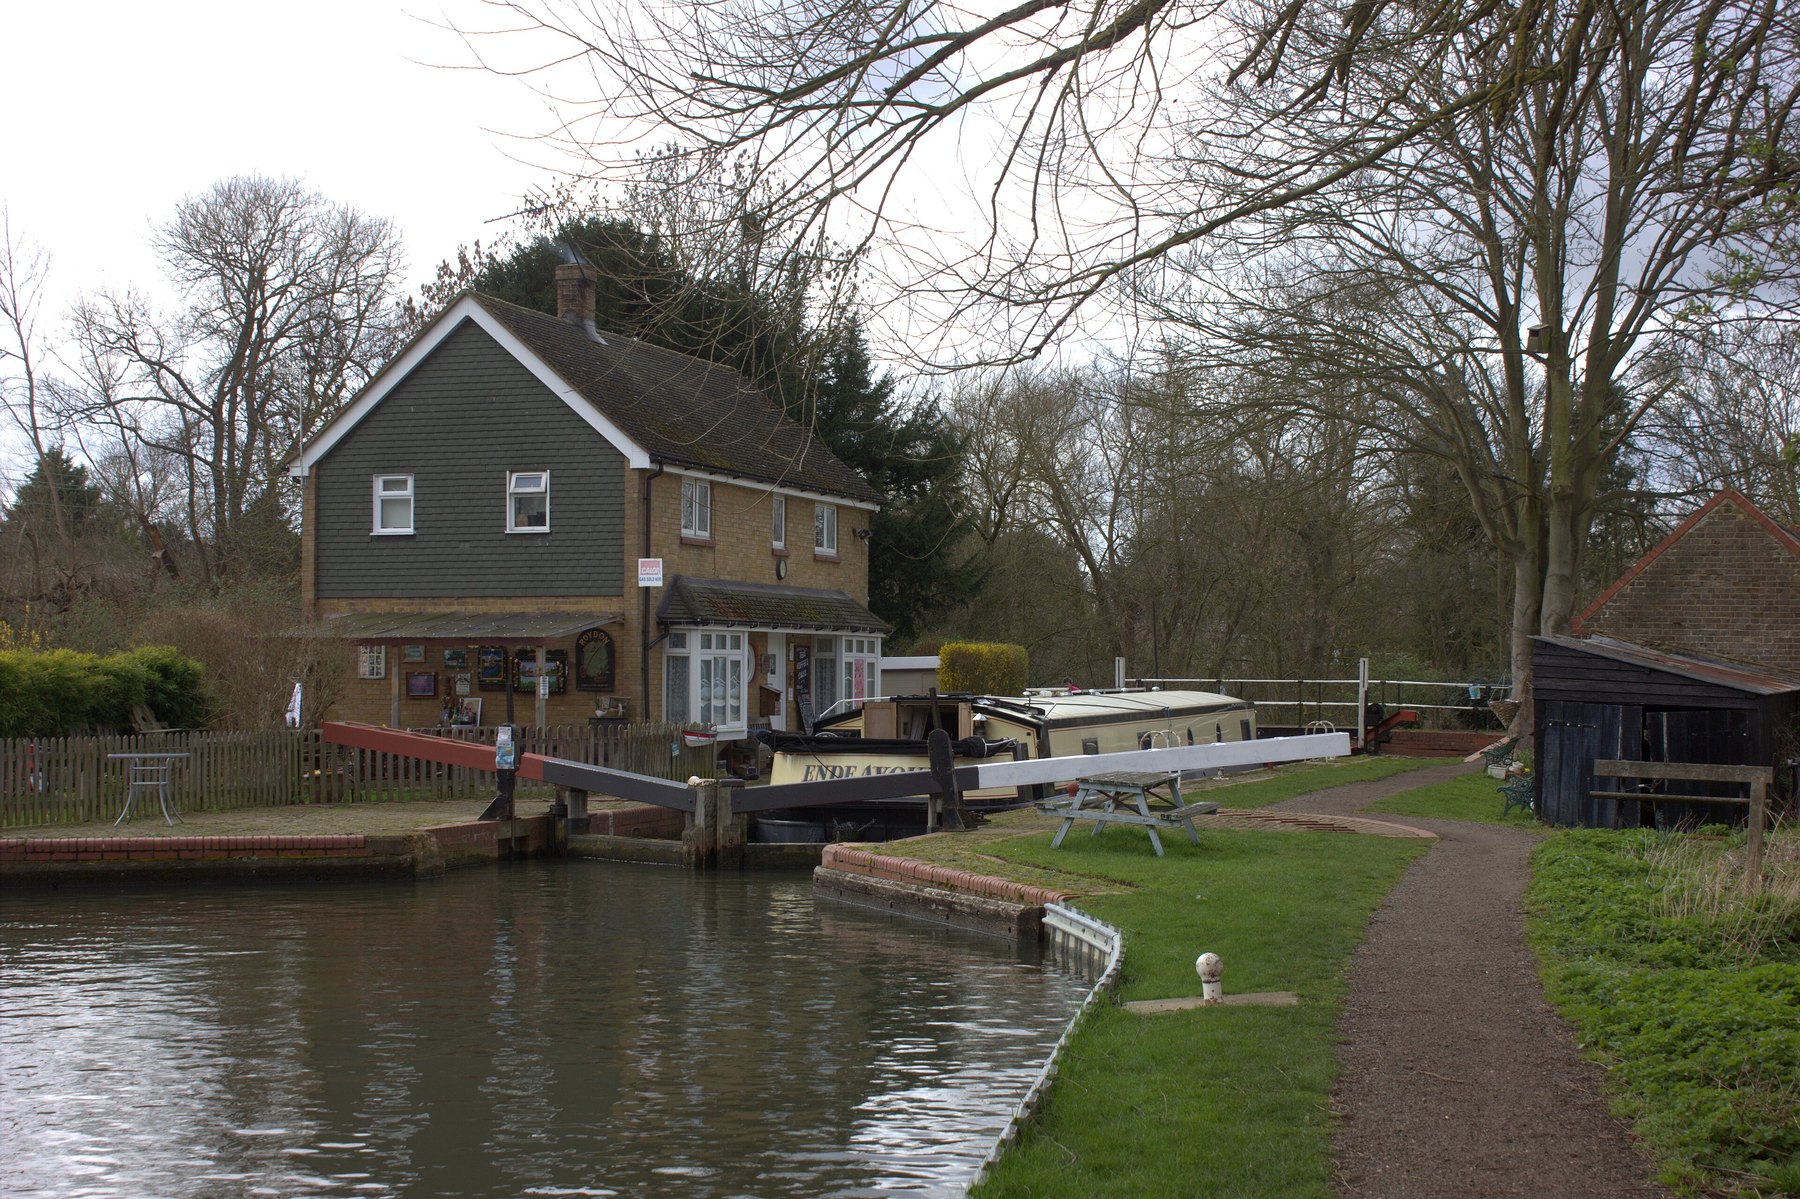
All photographs are of Harlow and are reproduced from Wikimedia Commons under the licences named. Images were cropped and scaled only; nothing was generated, relit or composited.
All sources fetched 30 October 2026. Contains HM Land Registry data © Crown copyright and database right 2026, and Ordnance Survey data © Crown copyright and database right. This data is licensed under the Open Government Licence v3.0.
Steven Bees and Lee Surtees
This report describes 885 sales. It cannot tell you what your own house is worth.
What a Harlow house sells for turns on the plot, the condition, the aspect, the lease if there is one, and what else is available the week it goes on. None of that is in the Land Registry record, and none of it is in the medians on these pages. A town median of £342,500 is a useful backdrop and a poor valuation.
What the evidence here is good for is the question behind the question. Whether your road is terraced or detached stock, and therefore whether it has moved +5.3% or not at all this year. Which of the four districts your postcode sits in, and what that is worth. Whether you are pricing into the deep part of the market or the thin part. Those are answerable, and we would rather answer them off the comparable evidence for your road than off a town-wide figure.
If you want that figure, ask us for it.
The Harlow Market, a housing market report for Harlow and postcode districts CM17, CM18, CM19 and CM20, October 2026. Written by Steven Bees and Lee Surtees. Published by Muvin. Sales data from HM Land Registry Price Paid Data, which is Crown copyright and database right, used under the Open Government Licence v3.0. Data to 28 September 2026, downloaded 30 October 2026. Figures are historic records of completed sales and are not a valuation of any individual property. This report is not advice on the value of any particular home.